How to Design Infographics That Elevate Your SEO and Digital Marketing Strategy
Infographics can be a key part of a successful content strategy. When designed well, these visual tools convey important information that tells a story users can understand at a glance. Because infographics distill important topics into a visual format, they are very shareable content. Therefore, great infographics don’t just look good, they will also support you in creating quality backlinks and engaging content that will keep your users sticking around.
Table of Contents
- Infographics as Key Communication Tools
- SEO and Infographics: Increasing Awareness and Backlinks
- All About Infographic Design
- How to Design an Infographic with Expert, Senior Designer Nicole Smiley
- How to Get the Most Out of Your Infographics
- Infographic Design Examples
Infographics as Key Communication Tools
Why are infographics great communication tools? Because, according to research, the human brain processes images better than words. Infographics often take a concept that could take paragraphs to explain and distill it down to the key points so the viewer can take a few moments and say, “Ah! I got it.” They are an excellent tool for quick comprehension, and are a complement to a longer blog post where users can dig into more detail if they wish.
SEO and Infographics: Increasing Awareness and Backlinks
Infographics aren’t just great communications tools, they also support your site’s search engine rankings. Because of the unique value they provide and the skill it takes to do it well, infographics often get shared in blog and social media posts. The more your infographics get shared, the more they expand your reach and create valuable backlinks to your site.
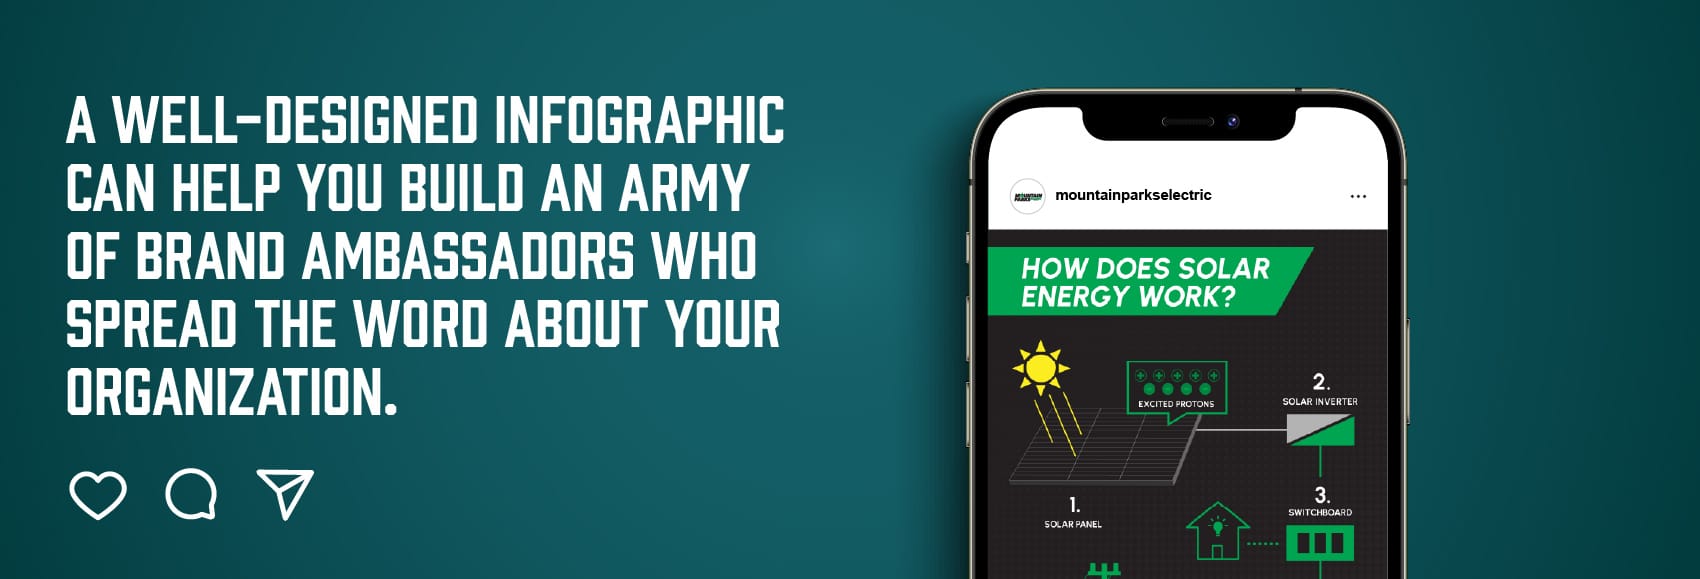
- Increase awareness and backlinks: When done well, an infographic is highly shareable content, others often share infographics to help describe complex topics. If your infographic is branded, these shares mean your brand is also making its way to others through word of mouth. If the share links back to your content, it can also give you a valuable backlink to improve your off-page SEO. Even when shared on social, you’re boosting positive engagement signals even if there is no direct SEO benefit. A well-designed infographic can help you build an army of brand ambassadors spreading the word about your organization for you.
- Increase dwell time: The more time users spend on your page, the more it indicates to Google and other search engines that your page is helping users answer their query.
- Build trust and credibility: Presenting complex information in a polished, authoritative infographic helps new audiences feel confident in your brand and reinforces credibility with your current users.
- Reusable content: Infographics are easily repurposed for social media posts and press contributions, making them a high-ROI design piece.
All About Infographic Design
With infographics, you can take “really complex information and get the gist in a 30-second glance. You’re boiling down key points to make the concept easy to understand,” said Nicole Smiley, senior designer at The Marketing Dept. Here’s what infographics can do for your content visually:
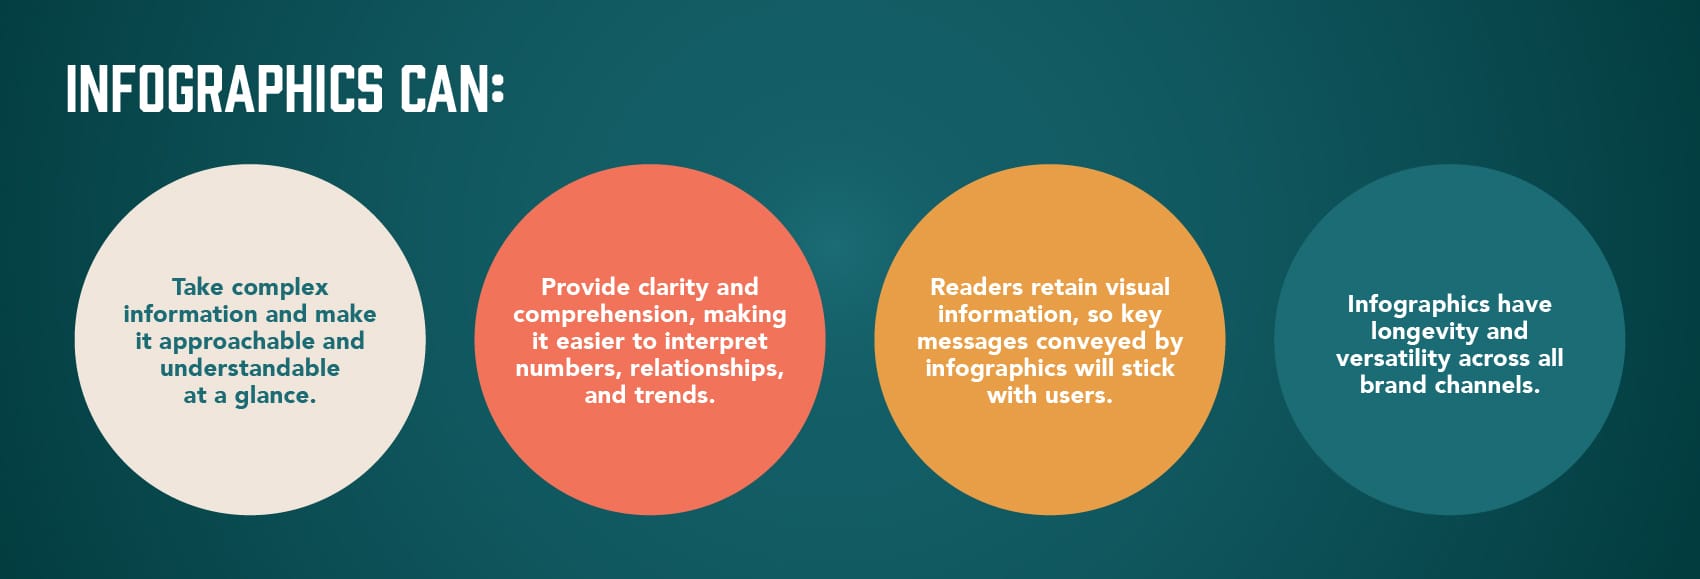
- Take complex information and make it approachable and understandable at a glance.
- Provide clarity and comprehension, making it easier for users to interpret numbers, relationships, and trends. Check out some of our infographic work.
- Readers retain visual information, so key messages conveyed by infographics will stick with users.
- Infographics might take some time to conceptualize and design, but they make up for it with their longevity and versatility across all brand channels.
How to Design an Infographic with Expert, Senior Designer Nicole Smiley
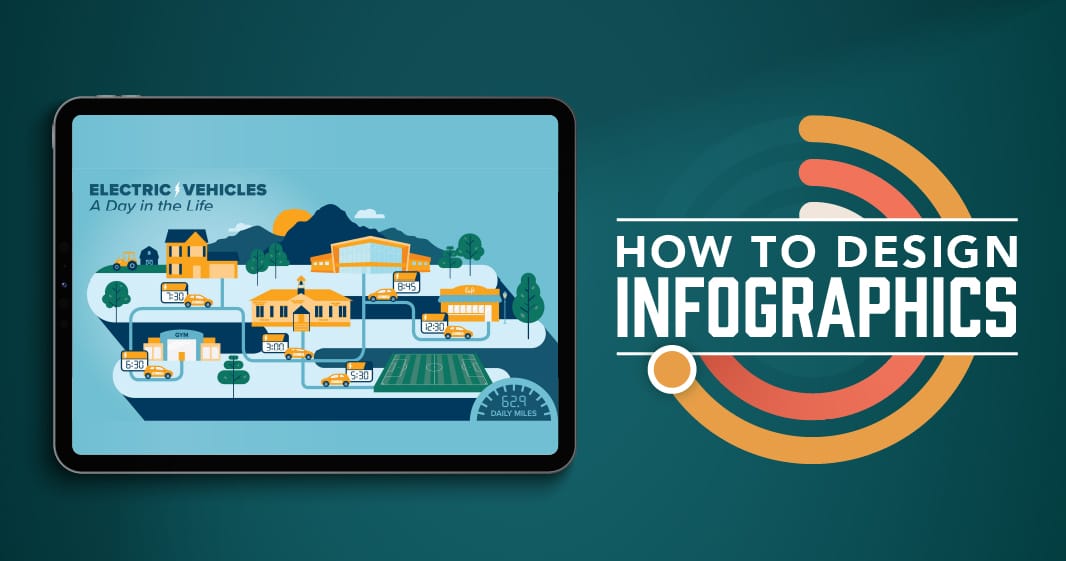
I feel that an infographic’s purpose is to take a complex idea, boil it down to key elements, and work to communicate those ideas in the simplest way possible. This way, no matter what the topic, anyone can understand the broad strokes of what you’re trying to convey. Sometimes that’s using simplified visuals or symbols to represent the idea (a lightbulb for electricity, for example), or it’s emphasizing certain parts of the text as a callout to ensure that it catches the readers’ attention. An infographic visually directs the flow through the information.”
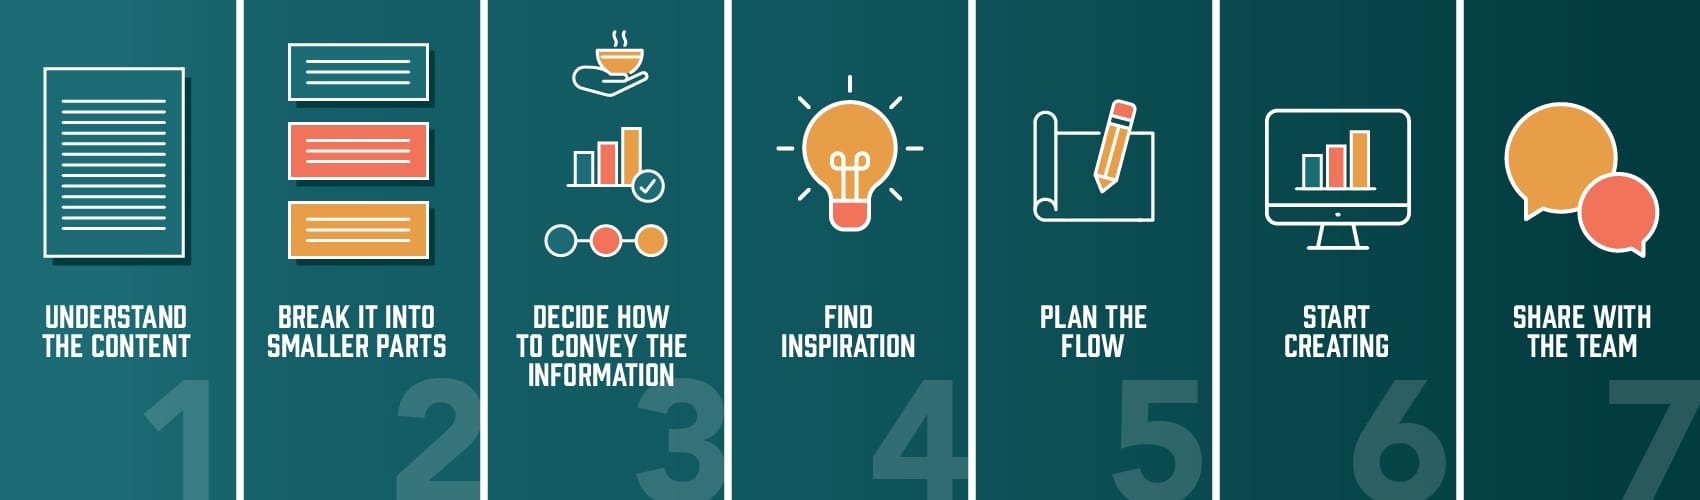
- Understand the content. Read through the information several times to get a firm grasp on it.
- Break the information into smaller parts. I start to create easy-to-read, understandable bits of information, simplifying the copy as needed. From this step, I hope to understand the key information and the overarching story we’re trying to communicate.
- Decide the best way to communicate the information. I start thinking about the best way to convey this information, whether it be through a chart, timeline, comparison, process, flowchart, or icons.
- Find inspiration. I research to see what’s out there on the topic, asking: how are others explaining this information? Is there a standard for the topic? How can I make our information distinct? Unrelated to the topic, what are some interesting ways information can be conveyed? Can I adapt them? When viewing competitor content, I always ask, “What do I like and why does it work?”
- Plan the flow. Next, I’ll do a rough sketch of copy blocks in the proportionate space. I’ll sketch and re-sketch, exploring a few directions. Then, I sketch out the visuals that I’d like to include, and start figuring out how they work with the copy. Eventually, rough sketches get more detailed as I start to get an idea of how I want the infographic to take shape. By the end of this step, I’ll know which visuals I want and roughly how they’ll work within the design and with the content.
- Bring my sketches to life in Illustrator. I’ll have actual content blocks rather than estimates and start creating the visuals I want to pair with them. I’ll start exploring my layout ideas from the sketching phase and start figuring out what is working and what isn’t. Eventually, I’ll pare the concepts down to one or two sketches. At this point, I’ll be tweaking the colors, alignment and making minor adjustments.
- Share with the team. When I share the infographic concepts internally, I get additional eyes and see which direction the team gravitates. Outside opinions are helpful for assessing whether things are flowing properly and whether someone unfamiliar with the content can understand quickly.
How to Get the Most Out of Your Infographics
If you’re just creating an infographic, plopping it on a blog post, and calling it a day, you’re missing out on some major ROI this content can deliver. Every piece of content you create should fit into a strategy that helps achieve your goals. Here are some ways to get the most out of your infographic
- Integrate your infographic into a well-optimized blog post to help your page rank higher.
- Add alt-text to the infographic to increase its searchability.
- Share an embed code that includes the source URL to increase your chances of earning backlinks when your infographic is shared.
- Create the infographic in various sizes so it can be shared via email and social media.
- Use your infographic as a powerful tool for gaining organic media.
Infographic Design Examples
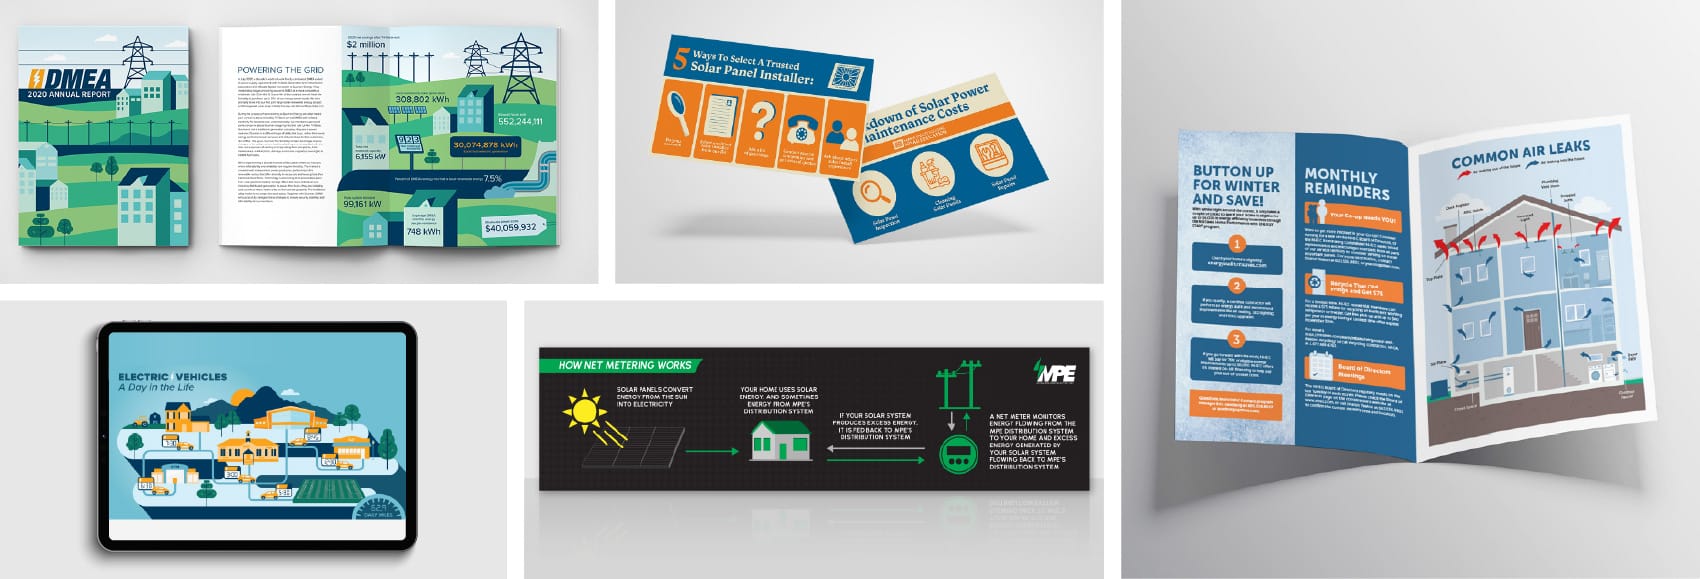
Do you need help making a complex topic approachable through visually compelling infographic design? Contact us to set up your free discovery session today.

")
